Essential Tips for Debugging JavaScript in Visual Studio Code

Sooner or later you will face some bugs in your application, that’s inevitable, this post will teach you essential tips for debugging JavaScript in visual studio Code so you can squash those bugs easier!
Introduction
Any code should be debugged. Everyone eventually goes through that process, and once they do, having useful tools available to them makes it much simpler to go through it. Applications written in Javascript can be debugged in a few different methods.
We can use the console to print some values or we can use the browser to place some breakpoints or we can utilize Visual Studio Code as it is likely your go-to code editor.
What is Visual Studio Code?
I just want to share my thoughts about VS coding in case you don’t know or are using another coding editor. Since I’ve been using it for years, PhpStorm is a fantastic program. But the price is high.
VS Code comes as an alternative with great foundations and tons and tons of extensions that you can use for whatever programming language or framework that you can think of.
One more tradeoff is that php storm or web storm are IDEs which means that they come packed with features and stuff right out of the box. Which for some of us can be a great thing, but sometimes we don’t need all of those things, especially if you are a beginner.
Using an IDE like php storm or web storm, and not using most of its features is a waste of resources first your money, then your computer power since they need much more ram memory and CPU power to work, which can be tiresome for some old machines.
Visual Studio Code offers a ton of plugins developed by the companies or community that you can use, meaning that you choose what you want to use and when you want to use it. You can enable/disable the plugins when you don’t need them.
What is debugging in JavaScript?
Debugging as the name says is removing bugs from your code. Bugs are basically errors that we make during software development. And it’s ok! We all make mistakes! What’s important is that we know how we can fix them. And learn to write better and more efficient code.
History of debugging
Interesting story about why computer errors are called bugs. Back in the day computers were huge, for example, the size of my room would be barely enough to fit one. So when the computer stops working engineers would need to open it up and find the source of the problem, not so often they would find a fried bug inside that caused a short circuit. So long story short, they needed to deal with some real bugs that were stoping computers from working.
Now when you have some interesting story to tell at some party, please don’t mention my name! 😀
Types of errors
Not all errors (bugs) are the same, some are easier to spot, and some will deprive you of sleep! There are a lot of error types in programming but I like to group them into two categories
How to debug a vanilla JS app in Visual Studio Code?
Let us start with the vanilla JS which I like very much to write. In my previous post about DOM manipulation, you have a code pen with a to-do application that I made. I will use that app as an example for this post too.
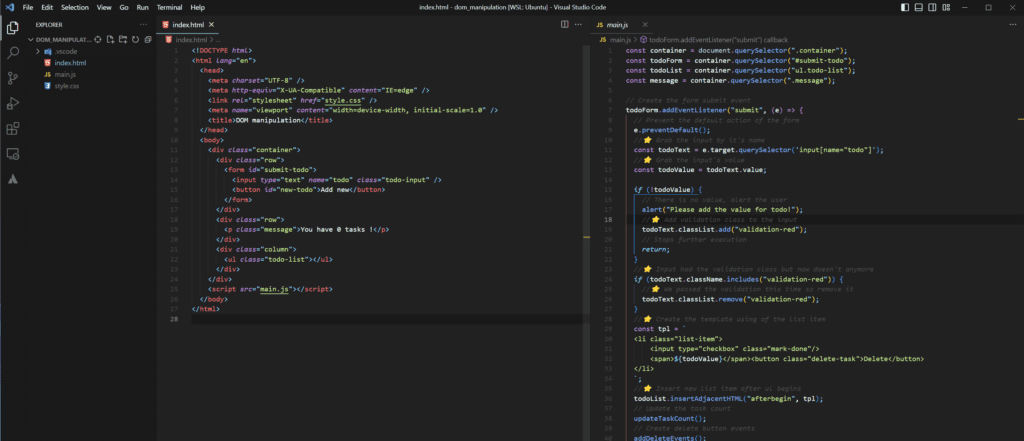
On the left sidebar you can switch from the file navigation to the debug tab in the left sidebar using the play icon with a bug shown in the image below.

When you open debugging sidebar you will have something like this:
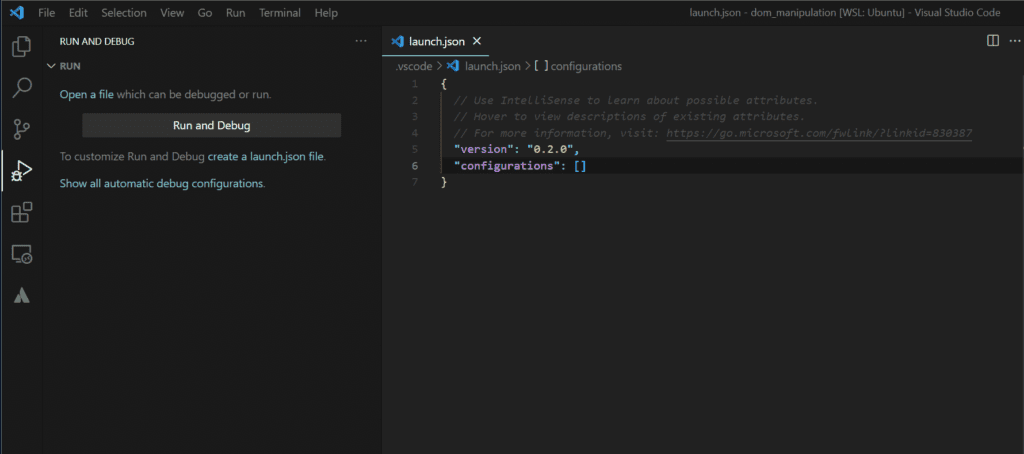
You want to add a new debug configuration, by clicking on the dropdown and then on Add Configuration… As shown in the image above.
Creating the debugger configuration in Visual Studio Code
You’ll see a launch.json file open up and a configuration array. In that array, you can add as many configurations as you want. I am going to add the following JSON object to the configuration array.
{
  "type": "chrome",
  "request": "launch",
  "name": "JS browser debug",
  "url": "http://127.0.0.1:5500/>"
}
Firstly set the type property to your favorite browser, I will use chrome you can also use Edge by setting msedge if you are on Windows, secondly set the request property to launch that’s going to open a new Chrome window for me with a running application, lastly for the name property you can use whatever you’d like.
Url is one of the most important settings here. I have used the live server extension. In order to get the url install the extension and click the go live button in the bottom right corner.
When you have all set up, you can go ahead and click play. That will open your app in a new window, and run the debugger too.
Voilà, you have the debugging in your code editor up and running!

As I said above we are all making mistakes and bugs, and nobody likes to debug the app for hours, I know how stressful it can get when you can’t figure out why your code doesn’t work. That’s why I suggest you read this post and try to write better Javascript code!
Conclusion
Applications are getting more complex and bigger by the hour. Therefore we need to update our debugging techniques, we can still debug simpler JS applications using the browser console, but when you have more complex applications, you need to mix them up.
My recommendation would be to mix things up if you want just to print the object or some variable, you should of course use the console it’s a lot faster than starting the debug only for that. But for more complex logical bugs you’ll need to use some debugging techniques like this.


